
See every stride. Find your shoe.
Stryd Footpath visualizes the unique path your foot travels during each stride. Tag your shoes in the Stryd app, and see how each pair reshapes your footpath, helping you discover which shoes work best for you.
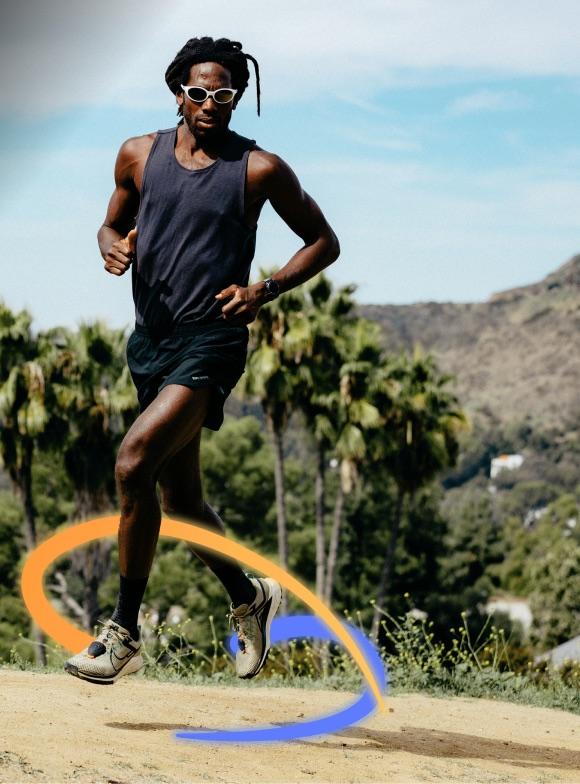
Gait analysis for your everyday runs.
Stryd Footpath brings the power of professional gait analysis to your everyday runs, giving you insights that were previously only accessible through specialized labs and complex equipment.
Your stride, in 3D.
Explore your footpath in a fully interactive three-dimensional space, and view it from any angle you like.
Every pair, tagged.
Tag the shoes behind every run in the Stryd app. Hundreds of shoes are ready to tag, and you can filter your runs by shoe.
The right shoe for each speed.
See how your running form changes at different speeds, and choose the best shoes for both training and racing paces.
Tag a run. See your footpath.
Every run, every shoe, every stride, logged and trended over time.
Tag
Tag your shoes in the Stryd mobile app so every run is linked to the pair you wore.
Sync
Open the Stryd mobile app after your run to sync your data.
Explore
Load an activity in PowerCenter and explore your footpath in 3D.
Compare
Compare shoes, runs, and laps to see how each pair reshapes your footpath.
Your footpath, from every angle.
The 3D Stryd Footpath lets you explore your footpath in a fully interactive three-dimensional space.
- Control the view. Rotate, zoom in, and pan across the 3D space.
- Jump to views. Switch to side, back, and top views with a single click.
- Mirror the view. Overlay and compare the footpaths of your left and right feet.
- Compare activities. Load and view multiple runs in the same 3D space.

See how each pair reshapes your footpath.
Tag the shoes behind your best run performances, then observe how different shoe choices reshape your footpath.
- Hundreds of shoes to tag. Pick your pair in the Stryd mobile app, and filter your runs by shoe.
- Footpath by shoe. Compare your footpath in two pairs of shoes, side by side.
- Left and right balance. With Stryd Duo, Leg Spring Stiffness Balance and Ground Contact Time Balance show how your left and right sides respond to different footwear.
- Mileage alerts. Set a custom mileage limit for each shoe. Once you reach it, you'll get a reminder to inspect your shoes.

Compare runs, laps, and drills.
Select and compare sections of an activity by lap to analyze your Stryd Footpath with convenience and precision.
- Lap selection. Compare any two laps of a run in the same view.
- Fatigue. Monitor how and when you begin to fatigue across each run.
- Drills. Quantify and visualize the impact of your drills on your footpath.
- Performance. Evaluate the impact of different paces and intensities on your technique.

Find your form strengths and weaknesses.
See how you stack up against peers and top runners on the metrics that truly matter.
- Critical Power. Track your overall running performance and compare it against others to see where you stand.
- Cadence and Duty Factor. Compare your step rate to find the sweet spot, and how long your foot spends on the ground relative to air time.
- Vertical Oscillation and Leg Spring Stiffness. Understand how your vertical movement affects performance, and how well your legs absorb and return energy.
- Gender and age group comparisons. See where you excel and where you can improve, compared with runners in your gender and age group.

Spot changes over time.
Time comparisons show how your form and your shoes change across months of running.
- See the impact of shoe mileage. Track how a shoe performs across different time periods to see how it changes with mileage.
- Visualize months of running data. Observe long-term trends in your running performance and shoe effectiveness.
- Optimize training intensities. Tailor your footwear to easy runs, long runs, and workouts.

Stryd Footpath in PowerCenter.
Available for Stryd Membership users. Tag your shoes in the Stryd mobile app, and explore your footpath in the Footpath Visualization tool on PowerCenter.


See every stride. Choose every shoe.
Stryd Footpath and Run Form & Shoe Analytics are available for Stryd Membership users. Tag a run today and start building a picture of every pair in your rotation.
More ways to run better.

Race Day Planning
Pace your goal race with weather, course, and form awareness.
Explore
Running Health & Load Management
Track metabolic and mechanical load, and changes in your stride.
Explore
Treadmill & Hybrid Fitness Racing
Accurate indoor pace for the treadmill and hybrid fitness races — no GPS needed.
Explore
Accurate Pace & Power
Run by effort, not by guesswork.
Explore
Personalized Drills
Drill routines tuned to your Form Profile.
Explore
Adaptive Training & Assistant
A plan that adapts daily, with an assistant that helps you make the call.
Explore